A visual notation for React's parent and owner trees
Introducing a visual notation for showing React components as diagrams, for more structural overviews that code can't show.
Published
Introducing a visual notation for showing React components as diagrams, for more structural overviews that code can't show.
Reading components as code means high 1 for certain tasks. Who renders this component? Where does this prop come from? How is it renamed or used on the way down? Where is this state defined? Where is its setter called? What re-renders when it changes?
Answering these is manual work. Jumping between components and files, perhaps console.logging.
While doing this, I could often feel my working memory clog and lose track.
Working memory is small and fragile, it has limited capacity and decays quickly.2 Tracing a prop up four components means holding component names, prop renames, and your place in the tree all at once, and every jump shows you a screen full of new, competing information.
Experienced devs don't have bigger working memories, they just know the codebase well enough that whole chunks of it collapse into single familiar things. In a codebase you don't know, everything is a loose item you have to hold at once. It's like how you need a map for a city you've never walked.
How can we reveal the structure when it is not in your head yet? There's React DevTools, which show the full parent tree, or on click of a component, the owner tree.
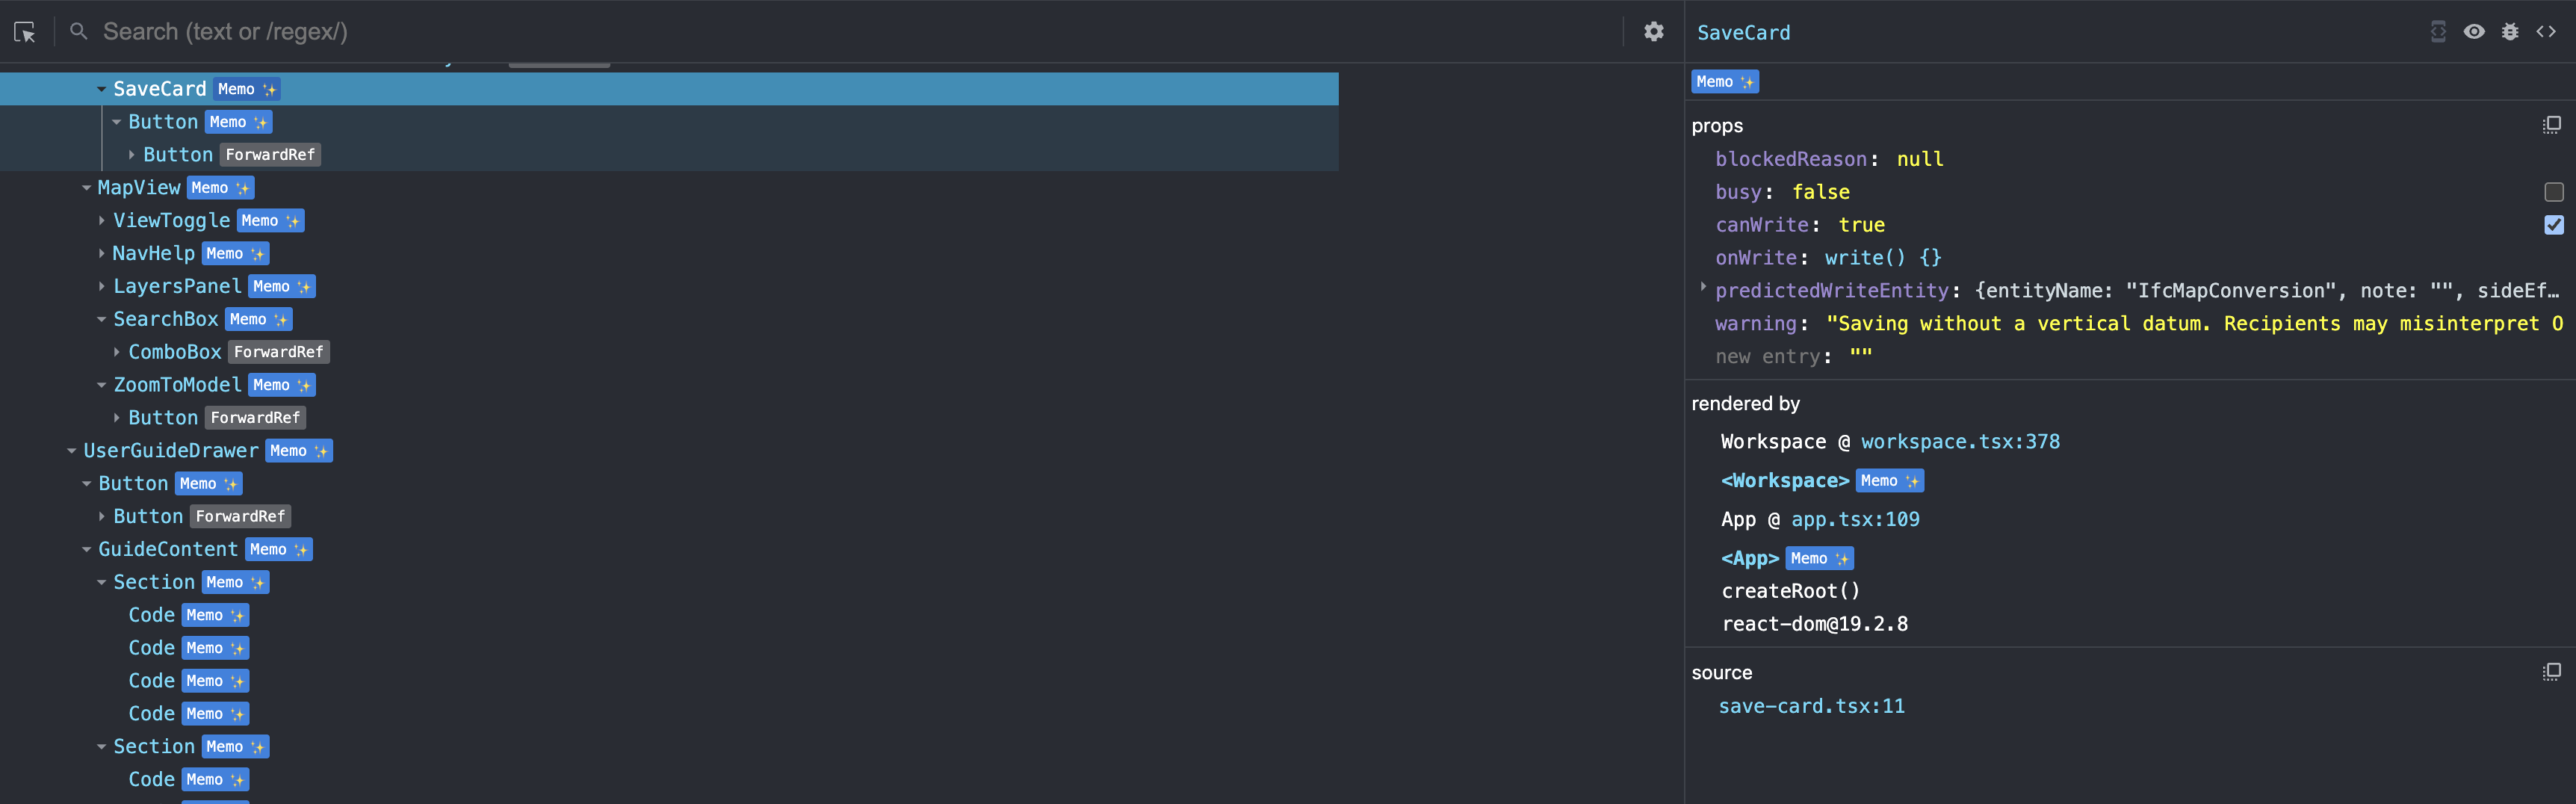
React DevTools
The React DevTools are nice.
But the display is still very textual. It's a wall of component names, with indents and a few badges. And it can't show both the parent and the owner tree in one view.
In React, I often wished for something more visual and spatial, a more structural overview. Something like a map. When I was trying to understand some part, I'd reach for pen and paper to draw small diagrams, drawing the parent tree as an indented tree with circles for each component, along with their names. I wouldn't draw a whole app, just the surrounding components.
This externalised the structure of React, the structure we can't easily see in code. Laying it out like that unburdened my working memory. It made it easy to see how one prop moves down multiple levels. The circles and lines do a lot more work than indents ever could.
For my Parents & Owners series, I formalised the scribbles and drew them in code. I found the diagrams very effective there, much more so than words and code alone. I have used them to explain React in my blogposts since. I've been toying with the idea of expanding them into a visual grammar. To take it from scribbles to something a tool can generate for us from code.
Recently I ran into bippy by Aiden Bai of million.dev, which revived this idea. bippy can read a running React app's fiber tree. With Claude Code I built a rough tool on top of it that draws these diagrams, either from a live app or from a small React snippet. I tweeted a video and it got a fair amount of attention. Here, I want to introduce the visual notation properly. I call these diagrams parent-owner trees.
function Title() { return <h1>Hello</h1>;}function TreeApp() { return ( <main> <Title /> <ul> <li>One</li> <li>Two</li> </ul> </main> );}
<TreeApp> owns all its children, it is both parent and owner to each.
So the parent and owner trees are exactly the same here.
function Frame({ sidebar, children }) { return ( <div> <aside>{sidebar}</aside> <section>{children}</section> </div> );}function Stats() { return <strong>3 clicks</strong>;}function SlotApp() { return ( <Frame sidebar={<Stats />}> <p>Content</p> </Frame> );}
When you slot JSX into a component through props, the parent and owner trees diverge. That is when we draw arcs on the parent tree to indicate ownership.
An element's owner is the component whose JSX created it,3 so a dashed arc runs from owner to ownee and points back to where its props come from.
<Frame> takes children and a sidebar element as a prop. Both of these are written in <SlotApp>'s JSX.
So every arc here leaves <SlotApp>, even though <Stats> and the paragraph sit inside <Frame>'s markup in the parent tree.
Where the two trees agree, the arc hugs the elbow. Where they diverge, the arc jumps rows.
The notation has a mark for each kind of thing the React API gives you. Your own components, the host elements they render to, and React's own components and APIs, <Suspense>, error boundaries, context, memo, lazy, <Profiler>, <Activity>, <ViewTransition>, and createPortal.
There is more on most marks in the sections below. <Profiler>, <Activity>, <ViewTransition>, and createPortal are niche, so they only appear in the map without a section of their own.
memo wraps a component and shallow-compares its props on each render, skipping the render when they're unchanged. It's loosely like a dependency array for your props, though not a real one.
docs.
const Greeting = memo(function Greeting({ name }) { return <h3>Hello{name && ", "}{name}!</h3>;});function MyApp() { const [name, setName] = useState(""); const [address, setAddress] = useState(""); return ( <> <label> Name{": "} <input value={name} onChange={(e) => setName(e.target.value)} /> </label> <label> Address{": "} <input value={address} onChange={(e) => setAddress(e.target.value)} /> </label> <Greeting name={name} /> </> );}
Note that the owner arc ends at the purple disc, not at the component circle. Props are delivered to the comparison gate, and the component only runs if they changed. The memo disc holds the retained props, what the next shallow comparison runs against.
The React Compiler does this memoization automatically at build time, so hand-written memo will get rarer. 4
Context follows the parent tree while props follow the owner tree.
const ThemeContext = createContext("light");ThemeContext.displayName = "ThemeContext";function Card() { const theme = useContext(ThemeContext); return <div>{theme}</div>;}function Badge() { return <span>new</span>;}function ContextApp() { return ( <ThemeContext.Provider value="dark"> <Card /> <Badge /> </ThemeContext.Provider> );}
A context provider is a row, colored when the context has a displayName.
Its area is the provider's parent subtree, where the value can be consumed.
The filled dot at the area's right edge is the context's current value, labeled with what the provider provides.
A line runs from the value to each component that calls useContext, ending at its name.
Here <Card> gets a line, <Badge> sits in the area but doesn't read the context value.
React's wrapper components are represented as filled squares.
There are five, <Suspense>, error boundaries, <Activity>, <ViewTransition>, and <Profiler>, each gets its own color.
A square's area is the subtree the wrapper applies to.
An area is either exclusive or inclusive.
Exclusive means nested squares of the same kind are subtracted, because the nearest one wins. <Suspense>, error boundaries, and <ViewTransition> are exclusive.
Inclusive means nested ones also apply and nothing is subtracted, as with <Profiler> and <Activity>.
<Suspense> and error boundaries are described in their own sections below. <Profiler>, <Activity>, and <ViewTransition> are a bit niche so they are in a details element.
docs.
<Biography> and <Albums> suspend via use(fetchData(...)).
function ArtistPage({ artist }) { return ( <> <h1>{artist.name}</h1> <Suspense fallback={<Loading />}> <Biography artistId={artist.id} /> <Panel> <Albums artistId={artist.id} /> </Panel> </Suspense> </> );}function Loading() { return <h2>🌀 Loading...</h2>;}
The amber square's area is what the fallback replaces. If anything in the area suspends, the whole area goes, and <Biography> and <Albums> appear together.
The declared fallback shows in the area's right gutter as a dashed overlay. Dashed, faded rows sit inside a dashed frame, waiting inside the region they will replace. Dashed means "not mounted".
Suspense is required for lazy:
const MarkdownPreview = lazy(() => import("./MarkdownPreview"));function LazyApp() { return ( <Suspense fallback={<Loading />}> <MarkdownPreview /> </Suspense> );}
Until the import settles there is no component to draw, only the lazy fiber React keeps, the row named lazy.
Once resolved, the component renders as a normal row wearing a small lazy badge, an indication of how it arrived.
An error boundary catches a render error anywhere in its subtree and swaps in a fallback.
It's a little odd that React still only has a React.Component based version, and no modern hook based version yet.
Most people reach for the react-error-boundary library, which to me is a sign React itself falls short here.
class ErrorBoundary extends Component< { fallback?: ReactNode; children?: ReactNode }, { hasError: boolean }> { constructor(props) { super(props); this.state = { hasError: false }; } static getDerivedStateFromError(error) { return { hasError: true }; } componentDidCatch(error, info) { logErrorToMyService(error, info.componentStack); } render() { if (this.state.hasError) { return this.props.fallback; } return this.props.children; }}
The mark is a red square. At rest, the square just outlines the subtree it protects. When something inside throws, the caught subtree goes error-dashed, those fibers are destroyed, and the fallback mounts in its place.
These three are quite niche so they're here for the interested reader.
The docs example, measuring different parts of the application:
function onRender(id, phase, actualDuration, baseDuration, startTime, commitTime) { // Aggregate or log render timings...}function ProfilerApp() { return ( <> <Profiler id="Sidebar" onRender={onRender}> <Sidebar /> </Profiler> <Profiler id="Content" onRender={onRender}> <Content /> </Profiler> </> );}
A slate square with the id as a badge. Its area is exactly what that onRender measures, here two <Profiler>s measuring two parts. Unlike catch regions the area is inclusive. Nested Profilers all measure the same work, so nothing is subtracted.
<ViewTransition> is stable since React 19.3. The docs example, with show defaulting to true so there is something to draw:
function Child() { return ( <ViewTransition enter="auto" exit="auto" default="none"> <div>Hi</div> </ViewTransition> );}function VTApp() { const [show, setShow] = useState(true); return ( <> <button onClick={() => startTransition(() => setShow(!show))}> Toggle </button> {show && <Child />} </> );}
Its area is the subtree it animates as one unit when a Transition mounts, unmounts, or restyles it.
Updates outside a Transition don't animate.
The nearest <ViewTransition> activates, so the area is exclusive, like an error boundary or <Suspense>.
A name badge appears only when you name one, which the docs reserve for shared element transitions.
Nameless boundaries get auto names.
The docs example. The sidebar keeps its state when hidden, unlike conditional rendering:
function ActivityApp() { const [isShowingSidebar, setIsShowingSidebar] = useState(true); return ( <> <Activity mode={isShowingSidebar ? "visible" : "hidden"}> <Sidebar /> </Activity> <main> <button onClick={() => setIsShowingSidebar(!isShowingSidebar)}> Toggle sidebar </button> <h1>Main content</h1> </main> </> );}
A green square with a visible/hidden badge. Its area is the subtree whose mounting <Activity> controls, and a hidden subtree renders faded, alive but dormant.
It's inclusive like Profiler, a nested Activity stays under the outer one's control.
I still haven’t written a single Server Component. So it feels disingenuous for me to say much about it. I have read a lot about it though. I know that understanding the difference between the parent and owner tree is crucial. I've read that this often trips up developers, it's "hard to reliably reason about the RSC boundary in Next.js". These diagrams can aid in showing the server/client boundary.
export default function RSCPage() { return ( <main> <Article /> <Tabs> <Comments /> </Tabs> </main> );}
Server components render in the server color. <RSCPage>, <Article>, and <Comments> ran only on the server, so their rows and the edges between them are drawn in that color, with italic names. They ship no JS and have no fiber on the client. <Tabs> is the 'use client' entry, marked with a badge, the boundary where props crossing in have to be serializable.
The interesting one is <Comments>. It's a server component, but it's passed as children into the client <Tabs>, so a server-colored row sits inside a client subtree. Its owner edge still comes from <RSCPage>, the colored arc jumping into Tabs's children. That interleaving is exactly what's hard to see in code, and what the owner tree makes visible.
That's the whole notation. It drops the code inside a component and keeps the structure between components. You read the code for what a component does, and the tree for how components relate. Neither replaces the other.
So what does the tree let you see that the code doesn't? Concretely, a few questions it answers at a glance:
memo stop it? Re-renders follow the owner tree, not the parent tree. The arcs show this.What I want most from this is for people to understand React better.
The structure between components is important, implicit, and hard to see. Those are the three things sbensu says are worth visualizing, and the React tree is all three.
Drawing it is meant to raise React's "literacy," in diSessa's sense, thinking done partly in an external notation.5 A visual that makes us smart.
Two ways I see this going. A tool for teaching and explaining React, and a devtool for understanding real apps.
This is where the notation works today.
I know React well. It has a shape in my head. Over the years I've seen a lot of idiosyncratic React, with the misconceptions showing through.
The diagrams make React's concepts and API more explainable than I can with code and words alone. I've used them in my blog posts for a while now. And occasionally I'd pull one up in a code review to show how the components could be composed better.
I don't think there's enough work on building developer tools for learners. There's a lot of value in a dev tool that's precisely defined, so people can play around with it, and there's no confusion in what it means. Building tools that model how people think and give them what they need to overcome their misconceptions, that's a really cool area I'd love to see more of.6
I have more ideas than time for React posts that lean on this notation.
I must admit I barely write React components by hand anymore. Claude Code generates most of it, and I do check what it made.
That changes the intro. However, the cognitive load didn't go away, it moved. I used to hold a codebase's structure in my head because I'd written it. Now I read code I didn't write and never chunked, so I'm in the unfamiliar-codebase position all the time.
With LLMs, perhaps we can afford to care less about the details; the exact code. I think that makes the need for a higher-level view all the more important.
I always imagined this notation would be useful in code reviews, reviewing React written by other people. In the last years that shifted with LLM's. Code is cheap now.
Code review will die. I mean: it’s already dead. But in the future, humans won’t find a bug or an issue with the code produced by a model, at least not in a reasonable time. Humans will only review the system and its composition, but it won’t be in PRs and it won’t be by looking through every line of the code.
What's left to review is the system and its composition, perhaps not every line.
Geoffrey Litt recently claimed understanding is the new bottleneck. We don't understand only to verify the agent's work, it's getting good at that itself. We understand to participate. Go too fast and you run up cognitive debt, where you lose the overview.
I mostly agree with this take. I know there are also AI maximalists who don't bother looking at the code anymore.
This is similar to what Karpathy describes in a recent tweet. Generated diagrams as one of the tools to understand what a model produced.
We'll be spending a lot more time trying to understand the outputs of language models. A few thoughts, tips & tricks:
[…]
Diagrams / images. Instead of writing, ask your LLM to create a diagram. These can be a lot easier to process, parse, and understand. But even better:
[…]
In summary:
- As LLMs get better, they will do more and more of the legwork autonomously, and a lot more of our work will rise up the abstractions into oversight and understanding.
- Luckily, LLMs can help here too because as intelligence and code are increasingly abundant, you can ask for large, custom, discardable software artifacts (e.g. web apps, video explainers) that would have never made sense to create before. Push the boundaries here and you'll be surprised.
The catch is that each model, and maybe even each session, invents its own notation. A shared visual grammar is different. A small set of primitives and consistent rules for combining them generate a large space of legible diagrams. You can read one you've never seen because the rules don't change. That's what this notation gives you.
AI is very good at React, but I still catch it doing things I'd have done differently. The architecture works but it isn't the one I'd have designed. For example, Claude Code likes to create large components over composition with children, tends to duplicate states, and often fails to use transitions. A good codebase is easy to change. Left to AI alone, we end up with a structure unoptimized for change. Checking that means seeing the structure of what was made. It's not that different from checking what your teammates have made, after all.
I should be honest, the tool I built is far from ready for this yet. It works on small, curated examples, not a real codebase. The insights that make a tool good only come from a serious context of use, and this doesn't have one. The hard part is reveal-and-hide on demand, showing the right part of a large tree instead of the whole thing.
It's maybe paradoxical that this tool is built entirely with AI. But this is the use I want from AI, tools that make us smarter and let us see what it's making. Augmentation, not automation.
This is a first design, and what it leaves out is as telling as what it shows. No hooks, no individual props, no conditional rendering, and no re-renders. Those are deliberate omissions for now, and some of them point at where it should go next. And underneath all of it is the reveal-and-hide problem from the last section. It takes a lot of thought and effort to get that right design-wise, to make it actually useful.
The bigger direction is tighter integration with the code. The notation is precise enough to be a , 7 and that precision is what lets the diagram and its code line up mechanically. These trees are generated from code today. A real visual formalism could go further, like a bidirectional tool where editing the diagram edits the code underneath.
Either way, these earn their keep most in your editor while you're reading and writing code, not in a browser looking at a running app.
I'm publishing this to see where it lands. It's mostly nice that it's out of my head, no longer just a line in my "Someday Ideas" note.
The notation is open. I welcome all to use it, extend it, or improve it. Please attribute this post when you do.
I built a couple of rough tools to go with this. You can try the snippet playground right now. Paste in React code and it draws the trees. The other tool I made reads a live running React app's fiber tree using bippy. I'll release it soon, or fold my work back into bippy. Aiden is already exploring something similar there. It's early, but I think it could be useful.
Some of the material that inspired me while writing this post.
Tonsky — Where Should Visual Programming Go? A great post that led me to a few other interesting ones. He divides visual programming into three levels. 1) Separate diagrams, 2) diagrams generated from code, and 3) diagrams are code. We're at level 2 now with the parent-owner trees tool. Making it a real "visual formalism" would take it to level 3.
sbensu — We need visual programming. No, not like that.
Found via Tonsky, who used it as the starting point for his post. He highlights where visual programming often falls short and shows a few examples of effective code visualization.
I particularly like this quote This is why visual programming matters: it often matches what people are visualizing in their head (or failing to). Generating a good diagram lights up their head.
C++Now 2018: Eberhard Gräther — The Untapped Potential of Software Visualization Found via sbensu's post. A cool talk on Sourcetrail, a C++ visualization tool that's now dormant. He shares this quote by Diehl that I like and find prescient. I've got to add that book to my reading list.
Programmers tend to adapt to the level of representation provided by the computer instead of adapting the computer's representations to their perceptive abilities.
Mike Bostock — A Better Way to Code An evergreen, it contains good caution for a project like this one. The notation isn't trying to replace code, it trades code's generality for legibility in one domain.
Code is often the best tool we have because it is the most general tool we have; code has almost unlimited expressiveness. Alternatives to code, as well as higher-level programming interfaces and languages, do well in specific domains. But these alternatives must sacrifice generality to offer greater efficiency within their domain.
Observable's Visual Dataflow Observable 1.0's dataflow graph, the minimap of cell dependencies. Observable is a notebook where cells have an arbitrary linear order. The code execution is a Directed Acyclic Graph. The minimap does a great job of revealing these two structures in a smart reveal-on-demand manner. It's one of the code visualization tools that I found actually useful. While using it I often thought "Man if only I had something like this in React".
Statecharts and XState I don't do much with XState these days, regrettably so. Having learned to think in state machines/charts helped me better handle state in React. It introduced me to visual formalisms, code as diagrams. Mapping all the states and the events gave me both the language and the visuals to think about UI state better. It's like folks who say learning another programming language (like Haskell or APL) changed their thinking and made them a better dev all around.
Felienne Hermans — The Programmer's Brain
Like the short-term memory, the working memory is only capable of processing between 2 and 6 things at a time. In the context of working memory, this capacity is known as the cognitive load. When you are trying to solve a problem that involves too many elements that cannot be divided efficiently into chunks, your working memory will become “overloaded.”Felienne Hermans The Programmer's Brain 4.2
Key observations about working memory • Working memory is fragile: limited capacity (4-10 chunks), easily interfered (competing stimuli), decays quickly (order of seconds)CS 1377 Tools for Thought Mnemonics Science and Tradition of Memory
In React, an element’s owner refers to the thing that rendered it. Sometimes an element’s parent is also its owner, but usually they’re different. This distinction is important because props come from owners.React DevTools Tutorial — Exploring Owners
Learn what React Compiler does and how it automatically optimizes your React application by handling memoization for you, eliminating the need for manualReact Compiler — react.devuseMemo,useCallback, andReact.memo.
I find that substituting the phrase material intelligence for literacy is a helpful ploy. Material intelligence, then, is an addition to "purely mental" intelligence. We can achieve it in the presence of appropriate materials, such as pen and paper, print, or computers. […] It is an intelligence achieved cooperatively with external materials.Andrea diSessa — Changing Minds: Computers, Learning, and Literacy (MIT Press, 2000)
At some level, AI tools will need to explain to us the behaviour of this code. People think of devtools as being for experienced developers, building visualizations, debuggers, loggers for big, complex codebases. But I actually don't think there's enough work on building developer tools for learners. Like the Aquascope diagram, the Rust ownership visualizer. That doesn't scale, you can't produce a diagram that makes clear sense of 300 lines of Rust code, but it doesn't have to. There's still a lot of value in having a dev tool that's formally defined, precisely defined, so people can play around with it and there's no confusion in what it means. Especially for learners, the space of ways people can misunderstand a programming language is very large. There's a very small constrained space of correct mental models and a very big space of all the things people can not get about what you're building. Understanding that space, building tools that can model how people think and contextually give them the information they need to overcome their misconceptions, that's a really cool area of devtool development that I would love to see more work in.Will Crichton — Rust for Everyone!
Our diagrams, which we call statecharts, extend conventional state-transition diagrams with essentially three elements, dealing, respectively, with the notions of hierarchy, concurrency and communication.David Harel — Statecharts: A Visual Formalism for Complex Systems (Science of Computer Programming, 1987)