Featured Observable Notebooks
Every now and then I have an idea for a diagram or data visualization and I like to play around with it in Observable, a reactive JavaScript notebook environment. Some of those ideas go nowhere and some of those get finished and make me feel good. Here are some of my favorite notebooks that I have created over the years.
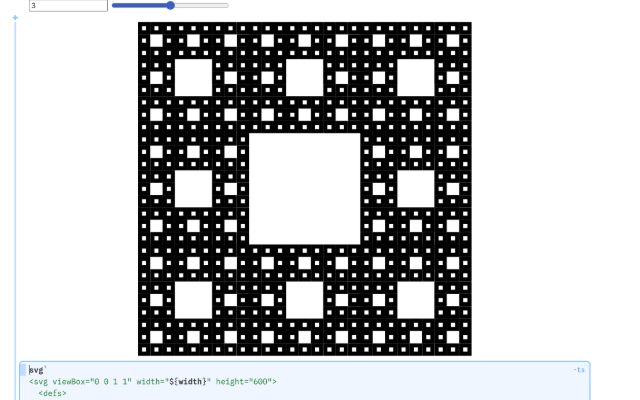
Self-Similar Patterns in SVG using <symbol>
Sierpiński triangles, carpets, and fractal trees from chained SVG symbols, with the viewBox doing all the scaling.
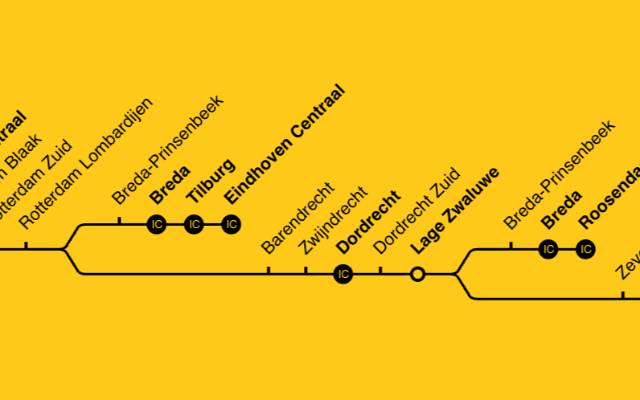
NS Line Diagrams
Recreating the line diagrams on Dutch railway platform signs with a custom D3 hierarchy layout.
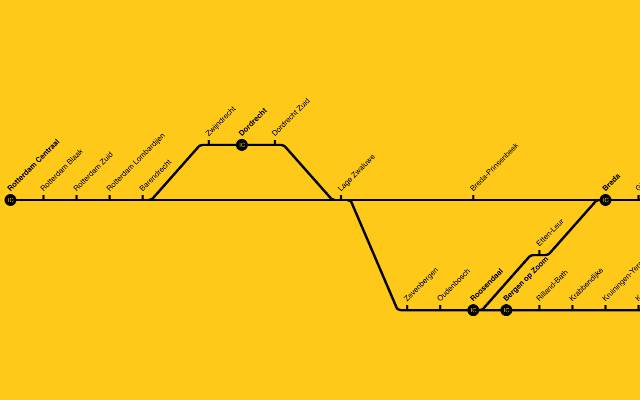
Better Line Diagrams
Redesigning the NS line diagram to encode network topology and the new NS service lines.
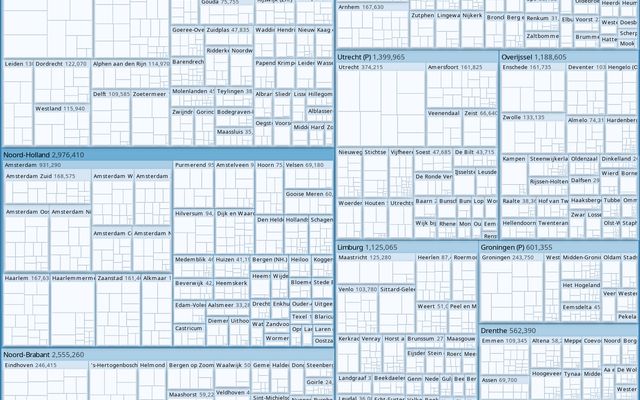
Nested Treemap Population of the Netherlands
The Dutch population as a nested treemap, from province down to municipality and wijk.
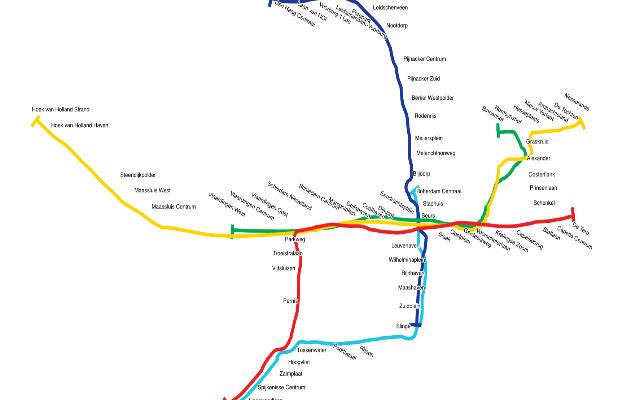
Rotterdam Morphing Transit Map
Rotterdam's metro network morphing between its geographic shape and the schematic transit map.
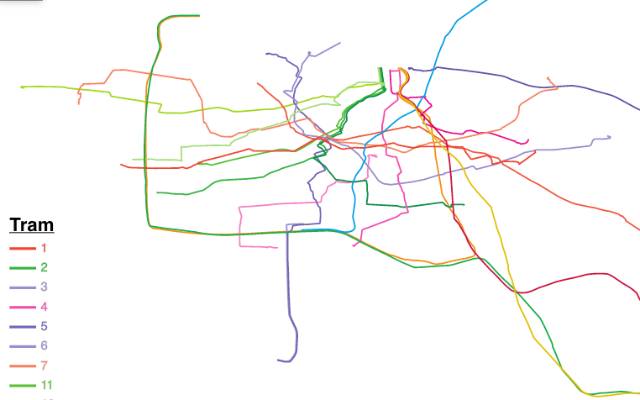
Amsterdam Morphing Transit Map
Amsterdam's metro network morphing between its geographic shape and the schematic transit map.
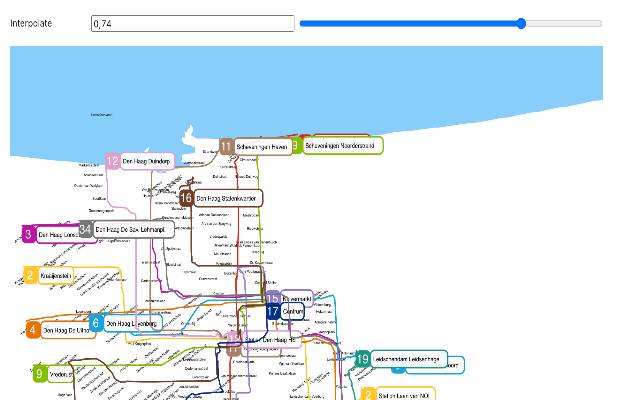
The Hague Morphing Transit Map
The Hague's transit network morphing between its geographic shape and the schematic transit map.
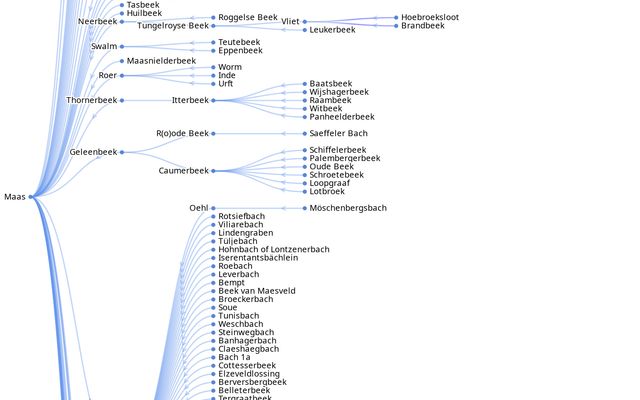
The Meuse River and its Tributaries
Mapping the Meuse and the network of rivers and streams that feed it.
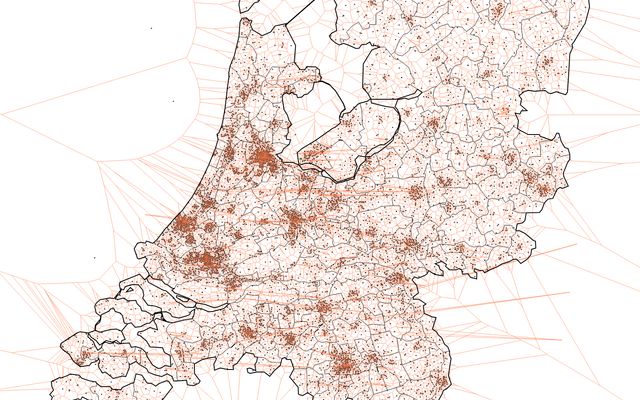
Voronoi Map of Cell Antennas in the Netherlands
Every cell antenna in the Netherlands and its geo-Voronoi cell, filterable by antenna type.
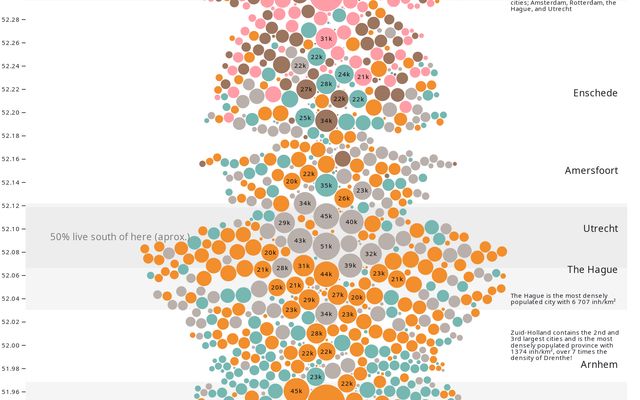
Dutch People from Eemshaven to Epen
The population of the Netherlands charted north to south, one dot per wijk.
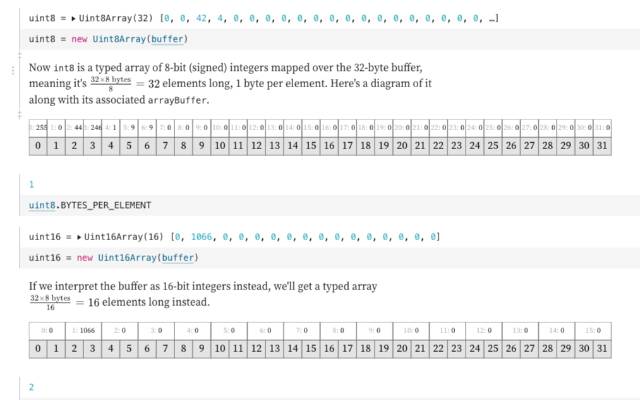
Typed Arrays and ArrayBuffers
An interactive explainer of JavaScript's typed arrays, what they are and when to use them.